
← Back to tutorialsGuides 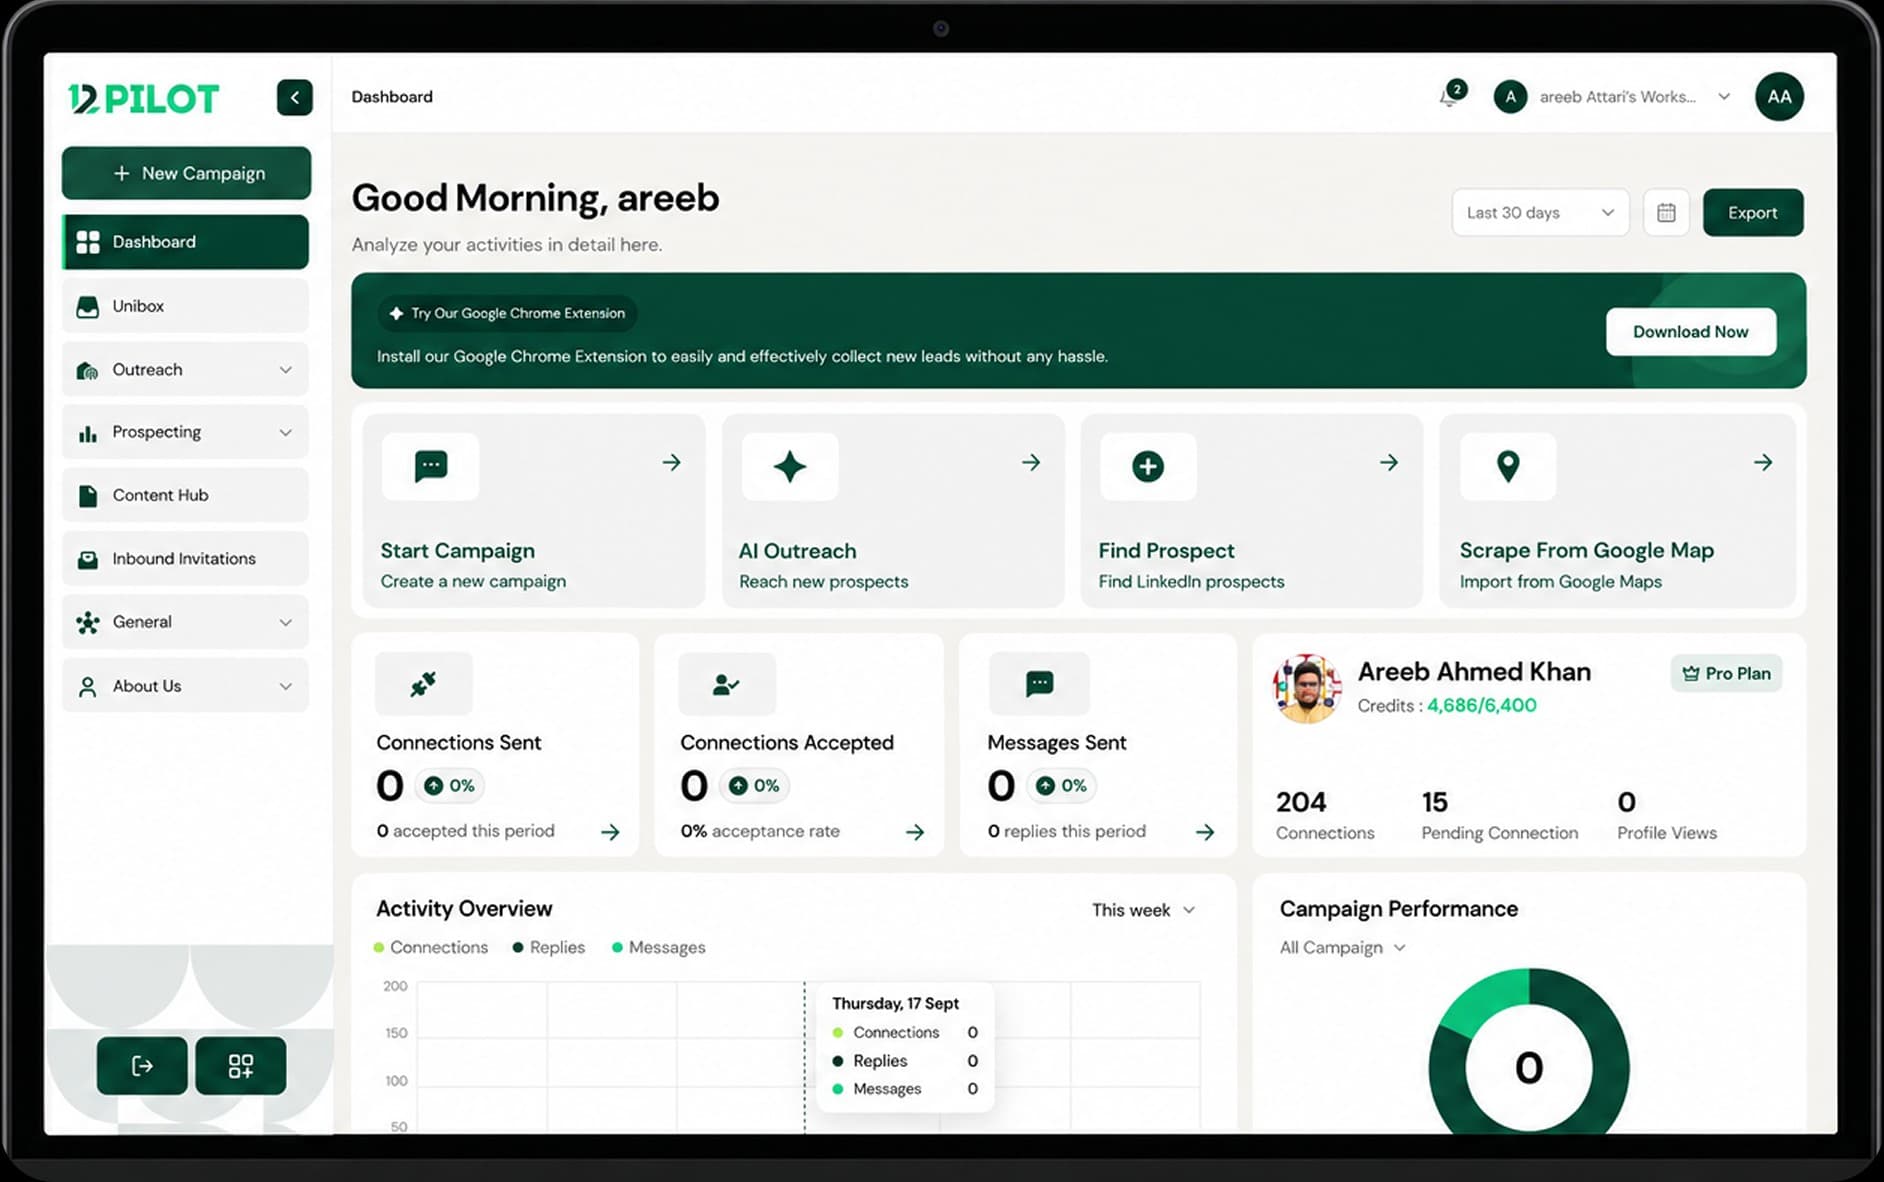 Open 12Pilot
Understand your dashboard
Read connections, accepts, messages, replies, and the activity chart.
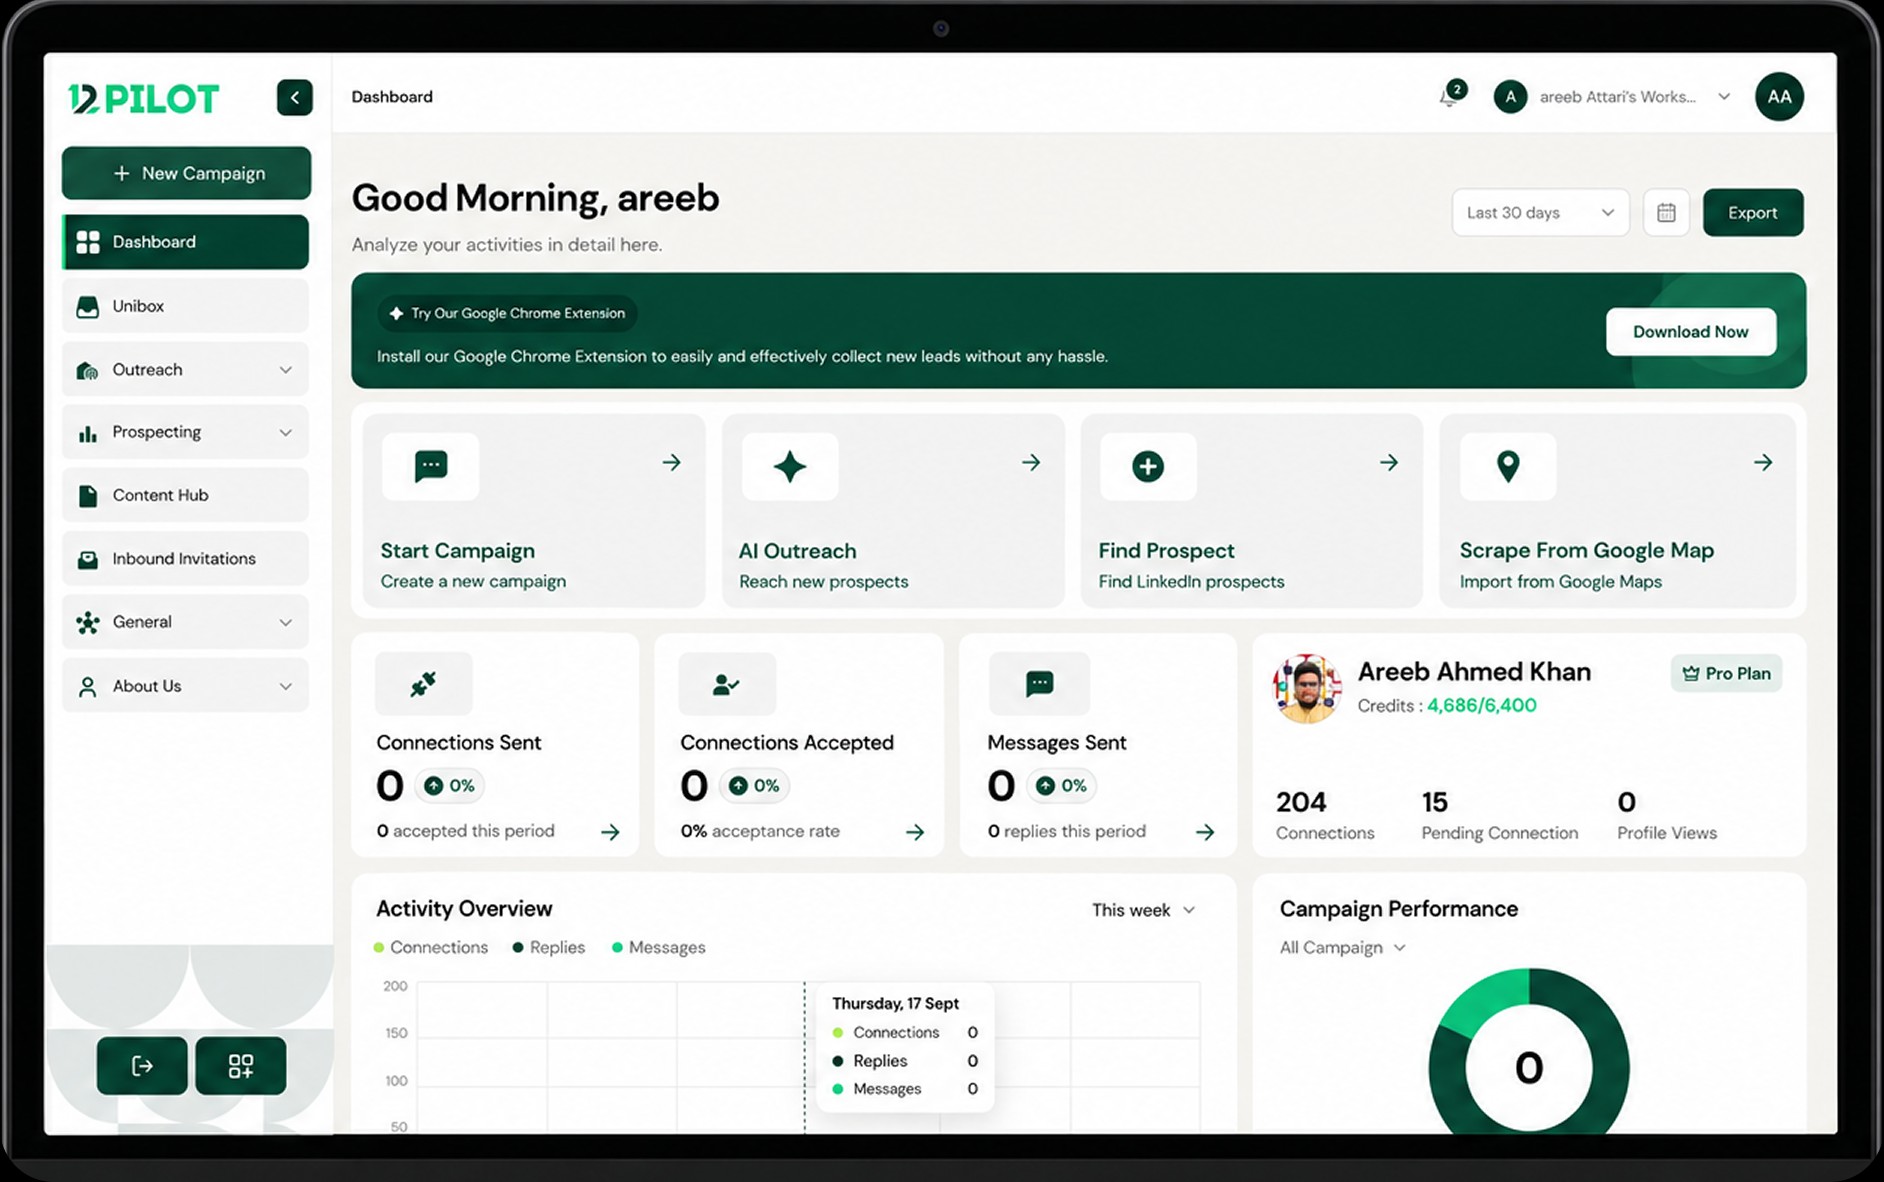
Dashboard shows workspace activity for the time range you pick (day, week, month).
Cards you will use
- Connections sent and accepted.
- Messages and replies.
- Profile views when that data is available.
- Active campaigns and total prospects.
Tips
- Change the time filter before you compare weeks.
- Empty numbers usually mean no LinkedIn seat is sending yet — connect an account first.
- Customize widgets from the dashboard if your workspace enabled that.